
Last updated: 20 Aug 2025 • Author: Aron Hosie
Executive summary
Signal — On growth velocity, Sui is the fastest‑growing smart‑contract L1 in 2025. Its top‑of‑funnel is massive (sustained periods of >1M new wallets/day, often >80% of DAAs), and the mix is rotating from consumer onboarding into DeFi/trading.
Scale — Solana remains the usage heavyweight (H1’25 averages ~3–6M daily active addresses, peaks >7M) with entrenched DeFi + NFT/social flywheels.
Context — The crypto user base is far larger than in prior cycles, so newer chains can ramp faster. Key takeaway: Sui’s slope is steeper; Solana’s base is larger.
What we measure (and why)
- Users & Activity — Daily Active Addresses (DAA), New vs Returning; transactions and fees.
- Capital & Stickiness — DeFi TVL & stablecoin float; DEX volumes; 30/60/90‑day retention.
- Builders & Surface Area — active developers, repo contributions; number of live dApps.
- UX & Onboarding — sponsored (gasless) transactions, wallet funnels, zk‑login adoption.
2025 leaderboard (headline view)
- Fastest growth: Sui (steepest indexed growth; consumer → DeFi rotation).
- Largest absolute usage: Solana (3–6M DAAs; dominates high‑throughput DeFi/NFT/social).
- Other high‑velocity L1s to watch: NEAR, TON, Aptos (not charted here).
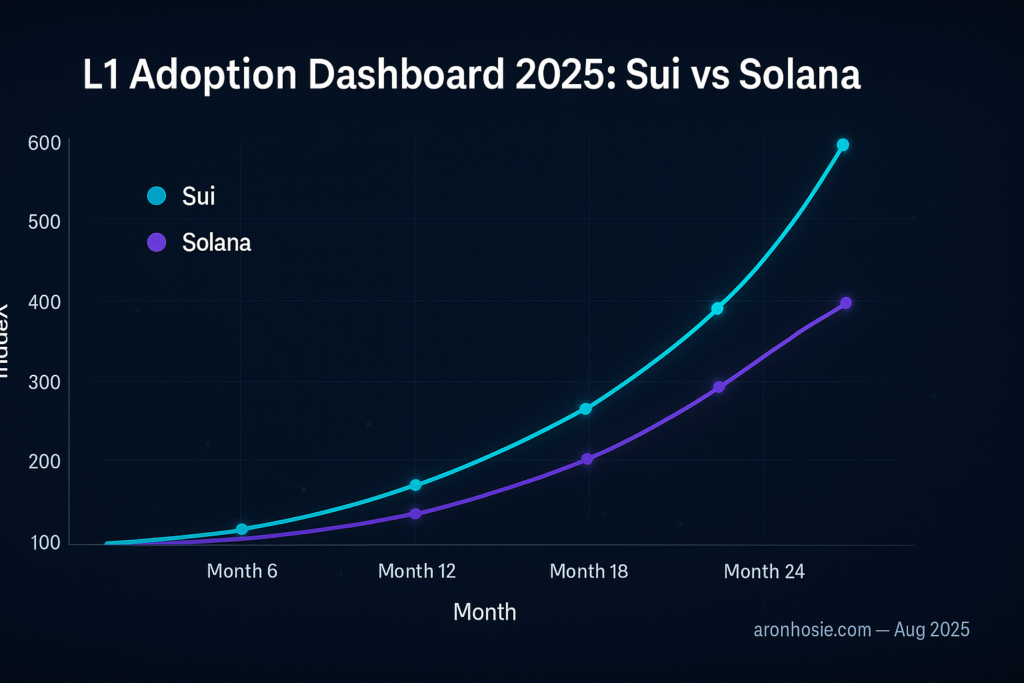
Indexed adoption — total DAAs (Month‑1 = 100)

Indexed adoption by segment — Sui vs Solana
Indexed consumer — Sui vs Solana

Indexed DeFi — Sui vs Solana

Indexed gaming/NFT/social — Sui vs Solana

Indexed infra — Sui vs Solana

New vs Returning (quality lens)
Sui — New vs Returning (indexed)

Solana — New vs Returning (indexed)

How to read this
- Slope vs Base — Sui’s growth slope is steeper; Solana’s base is larger.
- Conversion quality — Track New → Returning → Paying users and fee‑paying unique signers.
- Liquidity plumbing — CEX/DEX depth and perp open interest gate real adoption → price.
- Macro backdrop — A far larger user base enables faster ramps for newer L1s.
Methods & caveats
- Modeled monthly series (24 months) with observed H1’25 endpoints for scale sanity checks.
- Addresses ≠ people; segment splits reflect realistic, time‑varying shares (consumer → DeFi).
- Use with app‑level cohorting for exact figures when Artemis/Messari/Dune exports are available.
Sources (high level)
- Sui: >1M new wallets/day and periods with >80% of DAAs as new (Artemis‑cited reports, 2025).
- Sui: ~23.4% sponsored transactions in Q1’25 (Messari — State of Sui).
- Solana: H1’25 daily active addresses ~3–6M average; peaks >7M (Everstake/X analyses).
- Market context: a16z State of Crypto 2024 (record monthly active addresses).